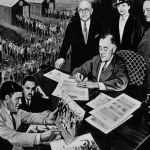
« previous | TPM CAFÉ READER POSTS HOME | next »
Weekend Electability Simulation
For the past three weeks I've used data from Votemaster Andrew Tanenbaum's www.electoral-vote.com as input to simulations of the general election matchups. As Tanenbaum does, I use the most recent poll in each state, averaged with any other polls taken within 7 days of the most recent poll. I'm using a 4% margin of error for the polls, and then I run a Monte Carlo simulation of many trials for each matchup, counting which candidate wins overall, and also their average electoral vote totals. This week I ran 100,000 trials for both Obama/McCain and Clinton/McCain matchups. The results:
Obama wins 37.1%, averages 264.7 EV
McCain wins 61.3%, averages 273.3 EV
Electoral tie 1.6%
Clinton wins 99.0%, averages 290.7 EV
McCain wins 0.8%, averages 247.3 EV
Electoral tie 0.2%
This week is both the strongest Clinton has been, and the weakest Obama has been, since I've started running this simulation. When I first ran the numbers, Obama beat McCain a little more than half the time, and McCain beat Clinton a little more than half the time.
Since last week, Michigan shifted from a 2 point Obama lead to a 1 point McCain lead, and Obama's lead over McCain in Iowa dropped from 8 points to just 2, and a new Texas poll showed McCain's lead widen from 5 points to 13. Obama gained in Virginia and North Carolina, where leads of 8 and 9 points shrank to 3 in each state, but the big key was shifting Michigan from very likely in Obama's column to more likely in McCain's.
Michigan was also a key state for Clinton this week, but where Obama lost his lead over McCain, Clinton improved from a 9 point deficit to a tie. She also saw her leadin Oregon widen from 1 point to 6, and like Obama she also improved in North Carolina and Virginia, where double-digit deficits dropped to 3 and 6 points, respectively.
These simulations are not a prediction of the general election, but they are a good summary of what the current state-by-state polling shows. Both Democrats run stronger than the nominal totals might suggest, but as of now Clinton does do better in state-by-state polling, because she has big leads in both Ohio (10 points) and Florida (8).
Obama trails by just one point right now in several key swing states (Ohio, Michigan, Florida, and New Mexico), and he's just 3 behind in a number of traditionally Republican states (Virginia, Nebraksa, and both Carolinas), so it's quite possible that the map can improve significantly for him as this becomes a direct 2 person race.
While I personally favor Obama, the current polling data do suggest that Clinton is running stronger versus McCain. I believe once the primary fight ends, Obama will pull solidly in front as the party unites behind him. One indication of that is that on www.intrade.com, Obama is trading at a 57% chance to win the general election, while McCain is trading at 37%, almost the opposite of my simulation results today.
What this does show is that it is important for Democrats to unite for the fall, as it's quite possible that Obama could lose without the full support of the party.


Comments (17)
Fossberry! Dude! Where have ya' been! Nice to see you're still around.
But listen--you're not using the Votemaster's numbers, are you? His Clinton/McCain and Obama/McCain maps are built from old polls, the vast majority not polled in May. Small states mostly haven't been polled for months.
Here's a sample of the most recent polls Tannenbaum counts for key states:
FL: 4/29
CA: 4/16
IN: 4/24
MA: 4/23
MI: 5/8
NM: 4/13
NY: 5/1
OH: 4/29
TX: 5/7
VA: 5/8
So tell me please that you've used recent polls gleaned elsewhere rather than the maps! If not, your model won't work.
May 17, 2008 10:46 PM | Reply | Permalink
I'm certainly aware of dates of the Votemaster's polling data. To paraphrase Rumsfeld, you crunch the numbers you have, not the numbers you'd like to have. I'm not aware of significantly more recent per-state polling data for the general election.
Survey USA did a full set of state-by-state polls at the end of February, and for some states, those are still the most recent polls. Newer polling data would clearly be better, and if you have a source of better data, I'd gladly use it instead.
My model is indeed not perfect, but it improves on Tanenbaum's map, which sums the leaders in each state to get an electoral vote total. By running simulations, I account for the effects of sampling error in the polls you do have.
And Tanenbaum's map is a better guide than national preference polling, because the Presidency is decided by the electoral college, not by the overall national popular vote.
As the race becomes a 2-candidate one, state-by-state polling should become more frequent, at least in those states that are fairly close. And in my model, pretty much once a lead is wider than the margin of error, that state goes to the leader virtually all the time. Stale polls of states that aren't really in play don't affect the bottom line.
But you're right that when stale polls are replaced by newer ones, that can change things significantly when the overall election is as close as these project. That's why I'm repeating the same analysis, using the same methodology, but just newer polling data, at different points in time.
May 18, 2008 2:32 AM | Reply | Permalink
BTW, here's the Votemaster's poll graph page, which shows how stale the data are:
http://www.electoral-vote.com/evp2008/Obama/Graphs/index.html
May 17, 2008 10:49 PM | Reply | Permalink
"This week is both the strongest Clinton has been, and the weakest Obama has been, since I've started running this simulation."
Fosberry, you do understand the concept "Garbage in, garbage out," don't you?
Running 100,000 trials on garbage data does not increase the accuracy of your results.
May 18, 2008 2:09 AM | Reply | Permalink
Running more trials and averaging results improves accuracy of the simulation in reflecting the input data, but as you note, if the input data aren't particularly useful, then the simulation results aren't, either.
Is that input garbage? Perhaps, but by running the same analysis using the same methodology at different points in time, changing only the input data, you can watch for trends or changes in the input data and see how they affect things.
I'd repeat that the Votemaster's site gets a lot of (IMO well-deserved) attention, and he's consistent in how he uses the data he collects. I think adding a simulation on top of the data improves the picture it gives, because when you're leading several states by much less than the margin of error (as McCain is now against Obama), you're not likely to actually win all of them. So McCain's lead isn't as big as the 290-237 Tanenbaum's totals today might imply.
May 18, 2008 2:42 AM | Reply | Permalink
Well, for what it's worth, I appreciate (and recommend) your simulations. Obviously, they're imperfect, but as we've said so many times in the past, the change in results is as important (if not more so) than the results themselves.
You're right that we absolutely need to heal this rift ASAP.
May 18, 2008 8:22 AM | Reply | Permalink
Thanks for the recommendation!
One thing I've been surprised at is how easily the winning percentages change. Two weeks ago, Obama was winning 80% of the time against McCain, and when I first did this three weeks ago, McCain was beating Clinton most of the time, but now she wins 99% of the time. Harold Wilson famously said that a week is an eternity in politics, and these swings certainly support that claim!
I originally thought I should simply use the polls' margin of error as input - that is, to assume the only variability is sampling error in the polls themselves. That's a clear and defensible model, but after tracking this for a while I've realized that it's not taking into account any variability caused by shifting public opinion. Also, once a lead gets beyond the 4% margin of error, in the model the person leading the state wins almost all the time, which makes things appear more definitive than they actually are.
Taken to extremes, if you use a big enough sigma, the whole thing devolves to a coin flip, and if you shrink sigma to zero, the model collapses to simply counting who is ahead, as the Votemaster's site does. The margin of error seemed to be a reasonable starting point, and when I first did the analysis, both matchups were quite close, with Obama beating McCain a little more often, and McCain beating Clinton a little more often.
A larger sigma for the polls would make a better simulation, as it makes it possible for states with wider leads to switch columns, reflecting possible changes in public opinion as well as just sampling error, as my current model does. Then the question becomes what sigma to use. And I don't have a strong opinion whether 1.5 times margin of error is better than 2 or 3 times.
With the current data, the more you increase sigma, the better Obama does, both against McCain and relative to Clinton. This is because in general, where Obama leads, he leads by a lot, whereas he tends to trail McCain by less. So adding variability gives him a better chance to pick up states from McCain's base than to lose ones from his own. So I could try to pick sigma to make Obama look better, and then try to justify the choice. But that strikes me as Mark Penn-like data manipulation: given enough data, and creativity, you can find numbers to back whatever position you want to advocate.
I prefer to stick with my original model, and simply watch how it evolves. I'll keep on running simulations with newer input data, and when the Votemaster stops printing McCain/Clinton matchups, I'll stop doing those simulations.
May 18, 2008 2:42 PM | Reply | Permalink
I would actually like to know how they decide who to call for the general election polls. Is it an average number of republicans, democrats, and independents based on projected turnout?
The reason I ask is that it doesn't make sense for it to be close for either Democratic candidate.
Look at the numbers, millions of new democratic voters, tons of republicans defecting, etc etc. I have even heard that only 20 some odd percent of the country is registered Republican at this point.
I know some of that is republicans crossing over to screw with things, however I personally know about ten republicans voting for Obama. Legitimately just wanting to vote for him.
Basically I look at how close things were in 2000 and 2004, then I compare that to all the new registered Democrats and given, I'm not sure how many republicans have joined their party but it doesn't seem like it could be that many.
It just makes me curious how they get there data.
May 18, 2008 6:04 AM | Reply | Permalink
Jsmith - Most reputable polls use some form of random sampling in deciding whom to call. They also take demographic information about whom they reach, and combined with demographic data for the region they're polling, they'll weight the results. I've read (I believe at www.pollster.com that polling firms never release raw data, they always weight it, trying to balance race, gender, party affiliation and perhaps other variables. And different firms do differ in how they weigh things, which often explains much of the difference in their reported headline numbers.
I think there are several possible explanations why current polling shows McCain beating Obama more often than not:
1. Obama is certainly well known among Democrats now, but likely less well known than McCain among independents and Republicans, but they're also sampled for general election polls.
2. The general public perception of McCain is still of a "maverick" (i.e. not Bush) Republican. So he is not as adversely affected by the administration as he likely will be by November.
3. I do think the negative attacks of the primary have hurt Obama.
4. It's quite possible that many, or perhaps most, pollsters have not adjusted their weightings to account for changes in voter registration, relying instead on older data.
I suspect a little of all of them may be at work, as well as other factors I'm not thinking of. The relative good news is that once the nominee is selected and the general election campaign begins in earnest, the first three factors should get better for Obama. And the fourth is irrelevant for the election itself, it just affects how well pollsters will predict the election.
So I'm still overall optimistic that Obama will win in November, but the current polling suggests McCain is ahead right now, and it's something to be aware of. I'm confident David Axelrod is already well aware of all these numbers, and is working hard on improving them.
May 18, 2008 2:09 PM | Reply | Permalink
Thanks, that makes sense. Anyone find it a little creepy that they can get fairly accurate statewide numbers by calling 1000 people within the state?
I think the main thing that makes me curious is that I know they weight the polling by the demographics, I.E. if the state has a 30% population of African Americans they make sure thirty percent of those polled are African American.
May 18, 2008 2:48 PM | Reply | Permalink
If you have a truly random sample from a population, you don't even need to poll 1000 people to get a 4% margin of error. And it's a heck of a lot cheaper to poll 500 to 1000 voters than to poll 5000 or more. And the added accuracy from a larger sample size generally isn't viewed to be worth it, especially when opinion can and does change quickly. You're better off doing a lot of relatively small sample polls with a bit wider margin of error than doing fewer larger sample ones with a smaller margin of error.
Now whether the sample is truly random or not is a question pollsters spend a lot of time analyzing. In the mid-20th century, a major pollster famously blew a presidential election (I think it was Truman/Dewey in 1948) because they did a telephone only poll. Most people at the time did have phones, but those that didn't were much more likely to vote for Truman than Dewey, so while the sample was a random selection of phone owners, the bias of ignoring non-phone owners caused them to blow the election.
The other big variable in primary polling this year has been turnout models. Especially in primaries, a big part of getting good polls is figuring out who is actually going to vote. A year like this, with a lot of new voters, is tougher for pollsters to get right, because the composition of the voting population is changing, and if their weightings don't reflect that, they can more readily miss the results.
I still think the main reasons Obama is a little behind right now are likely to be corrected as this becomes a two-person race. Once he's only being attacked by McCain, and once he's focused on making the sharp contrasts he has with McCain, I think Obama's numbers will improve sharply. But now, I'd guess a that to a sufficiently number of independents and even Democrats who haven't been moved to vote in this year's primary, Obama is that black guy whose name sounds vaguely like Osama, whereas McCain is the "maverick" Republican who distances himself from Bush. Those perceptions will rightly change in the fall, most likely to Obama's benefit.
May 18, 2008 3:48 PM | Reply | Permalink
Fossberry, sorry to have bailed after criticizing your method. If I hadn't had to perform major surgery (er, lock myself out of TPM with leechblock), I'd have tried to clarify that I understand the old poll problems; my personal problem is my frustration that we're forced to rely on old polls.
I find it particularly annoying that many of the old polls were completed at the height of inflammatory reactions to things like Bosnia, Rev. Wright I and II, etc. While I know that national polls don't help calculate electoral college results, I'm also sure that more current state by state polls for both Democratic candidates would be quite different.
Your method sounds fine to this mostly ignorant and lazy mind. But sometimes I just hate science, you know?
Looking forward to your next installment. Soon those damn polling houses will start fishing around in at least swingy states and we'll have fresh meat to chew on.
May 18, 2008 5:32 PM | Reply | Permalink
Oh, one more thing--I've only got 27 minutes before I get locked out again--one thing that hit a button for me was the word "current" in your original post. It might be clearer to say the polls are the most recent ones. That way you might meet a little less disbelief.
I recommended, by the way. This kind of thing is a bit nerdy to most people, but it'd be nice if it'd stay on the list long enough for the rest to check it out.
May 18, 2008 5:35 PM | Reply | Permalink
Good point. When I say "current" or "now", some people may infer that all the polls are quite recent, when in fact they're not. I should make it clearer that while I'm using the most recent polling data in each state (pollster.com pretty much has the same polls that electoral-vote.com does, but Tanenbaum's site puts it all in a single file per matchup that's easy to download and parse), many state polls are fairly old.
This should become less of an issue as we head deeper into the campaign. Close states will have more frequent polling, and in lopsided states the lack of recent polling essentially won't matter.
It's still just a snapshot of what the most recent polling says, and opinion will change as the campaign shifts. I hope and expect that change will be strongly favorable to Obama, but it is by no means assured. It's harder to get where you want to go if you can't honestly assess where you currently are.
May 18, 2008 7:02 PM | Reply | Permalink
What you said. Before my last post I actually flipped back and forth between realclearpolitics, E-V, and pollster.com, and found that indeed they all seem to have the same latest poll dates.
As we've learned this past several months, polls aren't exactly the most reliable predictors of anything, but at least it gives me something to think about.
By the way, any thoughts on http://www.fivethirtyeight.com/? I haven't spent much time there, but apparently Poblano uses some kind of non-polling demographic model or something with lots of weights and factors assigned to poll numbers...or something.
May 18, 2008 9:37 PM | Reply | Permalink
Umm, when's the election again?
This is just a remarkable waste of oxygen. You can run 100,000,000 simulations, but it won't even begin to give any idea of what happens between now and November, and that dynamic will determine the next president, not some ridiculous model based on today's polls.
May 18, 2008 10:47 PM | Reply | Permalink
I realize this thread is rapidly circling the memory hole drain, but I just want to second what Crusty Dem said.
The election is half a year from now, and Obama has yet to officially wrap up the nomination. Hillary theoretically is still in the mix.
Hand-to-hand, state-by-state battles between Obama and McCain have yet to start.
So week-by-week simulations of electoral college outcomes are a bit premature.
That said, Fosberry, I don't mean to discourage you from your hobby.
I just want to point out that you are attempting what purport to be precise calculations on data that just don't merit that kind of treatment.
Like you, I can't resist reading poll stories. But each one should come with the disclaimer "for entertainment purposes only," such as horoscopes carry.
I saw one just a few weeks ago that weighed the national appeal of Hillary and Obama; they were a few percentage points apart.
The pollsters had surveyed fewer than 300 respondents -- nationwide. Huge margin of error.
Yet it was duly published, and pundits commented on the trend it showed relative to the previous week's results. Absolute nonsense.
Back at the end of March, there was heated discussion here at TPM of an apparent midweek pro-Clinton spike in Gallup's daily tracking poll of the Hillary-Obama race. Various commenters advanced various theories.
Again, absolute nonsense.
The spike was a statistical artifact. Looked at over a longer timeframe, it vanished.
I've also seen individual polls broken down for subgroups, such as white, female, over-50 voters.
Do a little back-calculation, and you realize each percentage point represents fewer than 10 actual respondents. Sheer garbage.
By effectively increasing their samples, three-day tracking polls like Gallup's do increase their accuracy.
But nobody is doing that kind of polling on a state-by-state basis.
One 600-respondent poll (if you're lucky) is followed two months later by another of similar size.
So your electoral-college matchups -- even if you do new ones every week -- will reflect data that are both stale and unreliable.
If there is a definite popular trend over the next six months, however -- say, if Obama establishes a 10- or 15-point lead -- the polls will necessarily show that, and so will your calculated EC results.
Graphed over six months, despite the flawed input, your national results may very well document whatever real trends occur.
Over three weeks, though -- sorry, no.
If you intend to continue posting, try honing your disclaimer.
May 19, 2008 4:54 AM | Reply | Permalink
Post a Comment